Haringey’s population has fallen

For the past 15 years the population growth has dropped to its lowest level across the UK. The figures show that the biggest impact has been to the capital, with a decrease in immigration.
The Office for National Statistics said that an extra 392,000 people have been added to the UK’s population during the year up to the middle of 2017, this would take the total population up to over 66 million living in the UK.
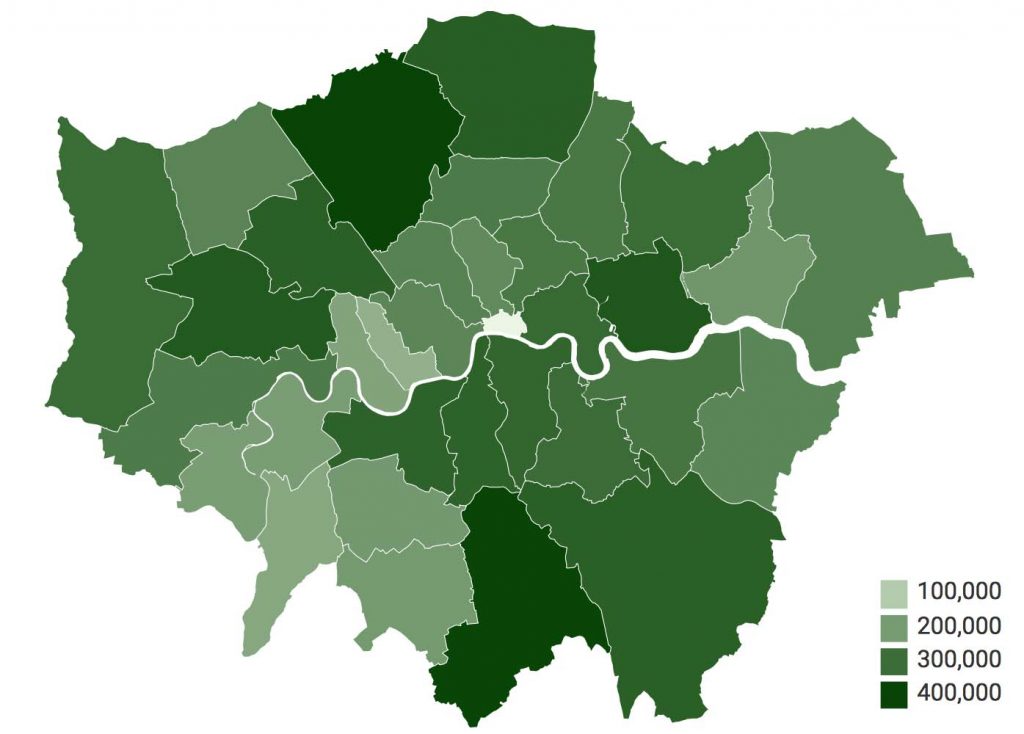
Even with the increase to the population, the rate of growth has been the slowest since 2004. With London seeing it growth almost halved due to a decline of net inward migration of overseas citizens. When we examine all the regions of London individually, we see that there is a slight increase in all regions, but the two boroughs that stood out were Haringey and Ealing.

WHAT PART DOES BREXIT PLAY?
The Migration Statistics Quarterly Bulletin for the period noted that: “The number of people immigrating for a definite job has remained stable but there has been a 43 per cent decrease in the number of people immigrating to look for work over the last year, especially for EU citizens… These changes suggest that Brexit is likely to be a factor in people’s decision to move to or from the UK – but decisions to migrate are complex and other factors are also going to be influencing the figures.”
INTERNAL GROWTH: HAVERING
It is one of the most noticeable details of the census ratios that London’s borough of Havering has increased, while internal migration has been taking place considerably in all regions. Another feature of Havering, located in the most northeast part of London, is the low rate of outward migration. While Havering had an internal migration of 922 people, the total number of international migration was 754.
GREATEST DECLINE: HARINGEY
Another highlight of the Haringey is the considerable drop in the number of internal migration. Haringey received an international migration of 3,020, while internal migration declined by a total of -6,644 people.
====
Haringey: 271,224
Change 2016-2017: -854
Birth – Death: 2,773
Net internal migration: -6,644
Net international migration: 3,020
Other: -3


